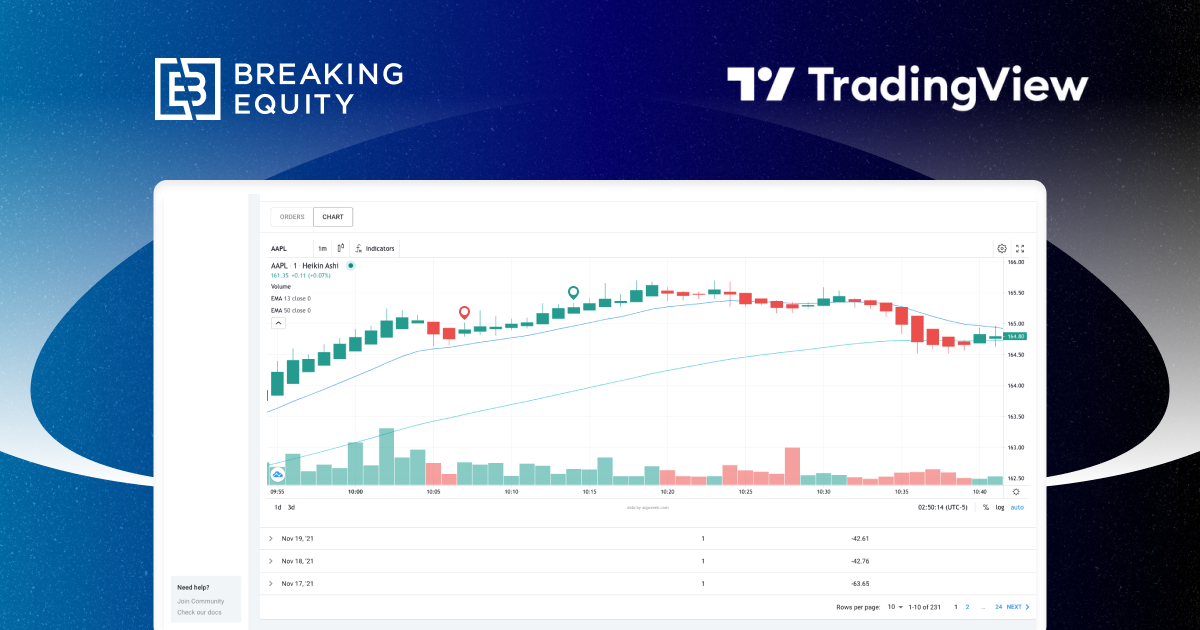
The charts you love, now on Breaking Equity. We’re excited to announce that TradingView Lightweight Charts and Technical Analysis Charts are available for every Algo trader.
3 reasons why this integration rocks:
1. Understand orders in details. See orders on the chart alongside all the indicators used in the Algo.
2. Improve your algos. Visually examine the exact data used in backtests and trading, find patterns and areas for optimizations.
3. Get a quick view into performance over time. See how your algos perform over time and compare them to buy and hold benchmark.
View your Backtest, Paper and Live Trading orders on a candle chart with all the indicators you have used. The candle chart load most of the indicators used automatically directly from the criteria used. There is no limit to how much you can add to the chart.
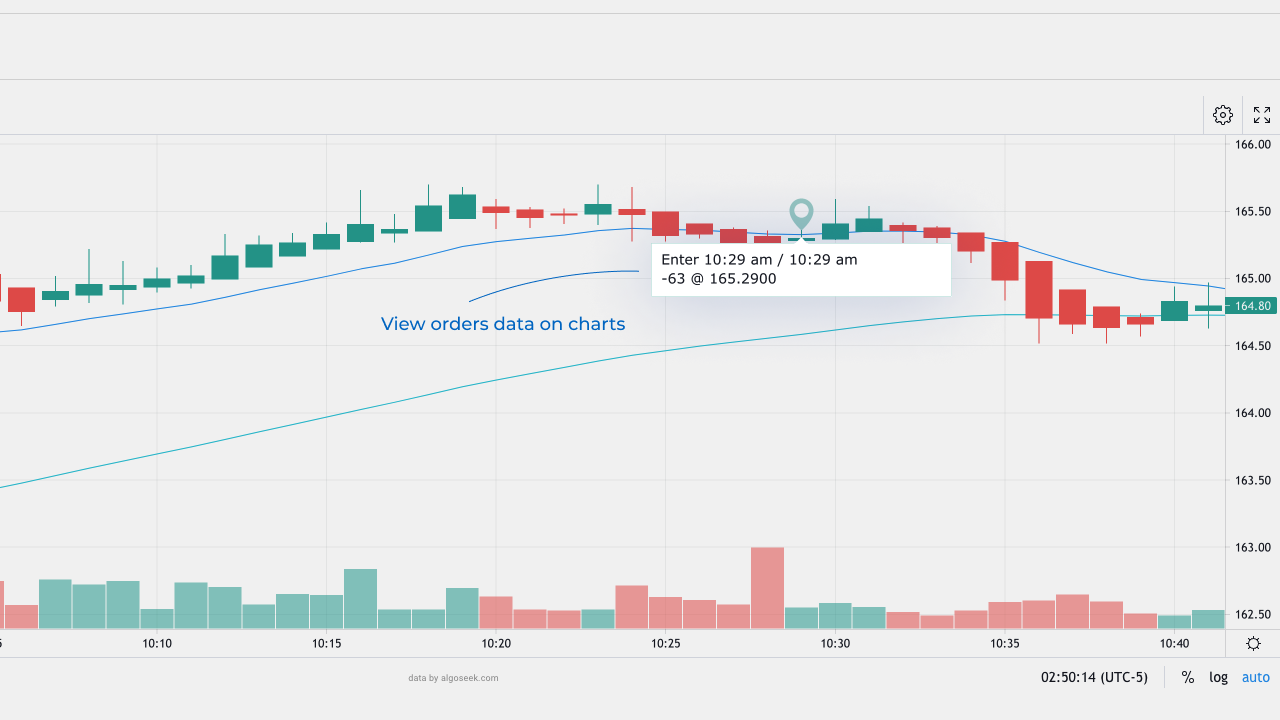
View orders data on the chart:
– Open time
– Close time
– Price
– # shares
We are looking forward to your feedback and suggestions so we can create the best algo-trading environment for you.
The Breaking Equity team